
Google Tag Manager is the best tool for tracking conversions and website activity. In addition to correctly integrating the GTM container into your page code, its fine-tuning and careful configuration is crucial. Is it working correctly, and is it even present on the site? The second question is relevant if, say, you’re just starting out with a new resource. I offer several ways to find the answers.
Checking for GTM on a website
If you’re not sure whether Google Tag Manager is enabled on your site, there are several ways to check for the presence of a GTM container.
Searching the website code
The easiest and fastest way to detect traces of GTM is to view the site’s source code. To do this:
- Go to the website.
- Use the command “ctrl+u” to go to the page code.
- Open the search bar using the command “ctrl+f” and enter “gtm.js” or “googletag”.
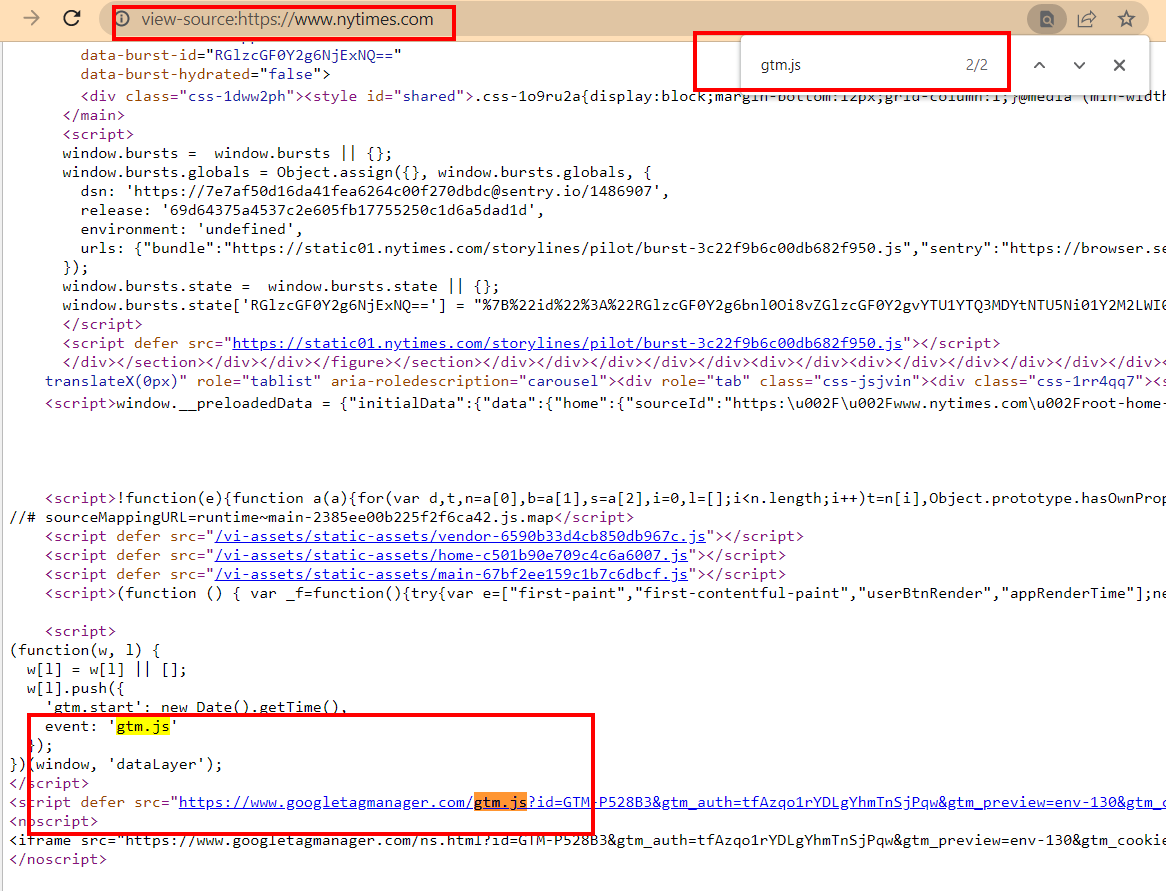
If the search returns matches, then the GTM container is already connected.
Next, you need to ensure that the GTM container embedded in the code is the one you have access to and plan to work with. Each GTM container has its own unique code (Container ID). You can view it in your Google Tag Manager dashboard.
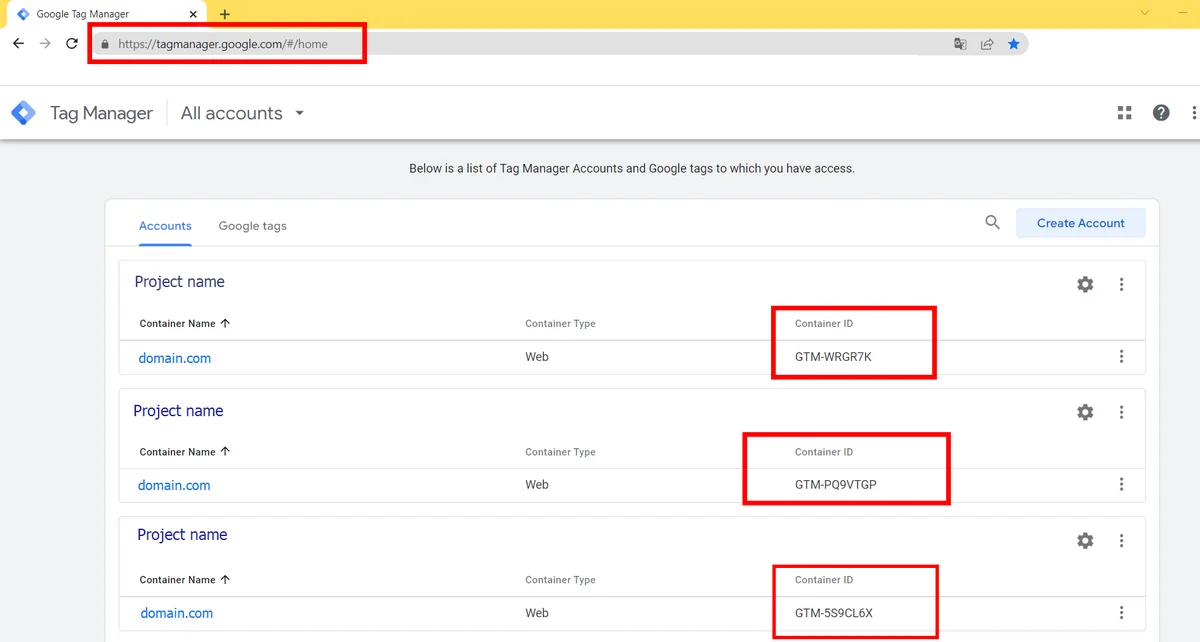
To do this you need:
- Go to the website.
- Use the command “ctrl+u” to go to the page code.
- Open the search bar using the command “ctrl+f” and enter the Container ID that you have access to in your Google Tag Manager account.
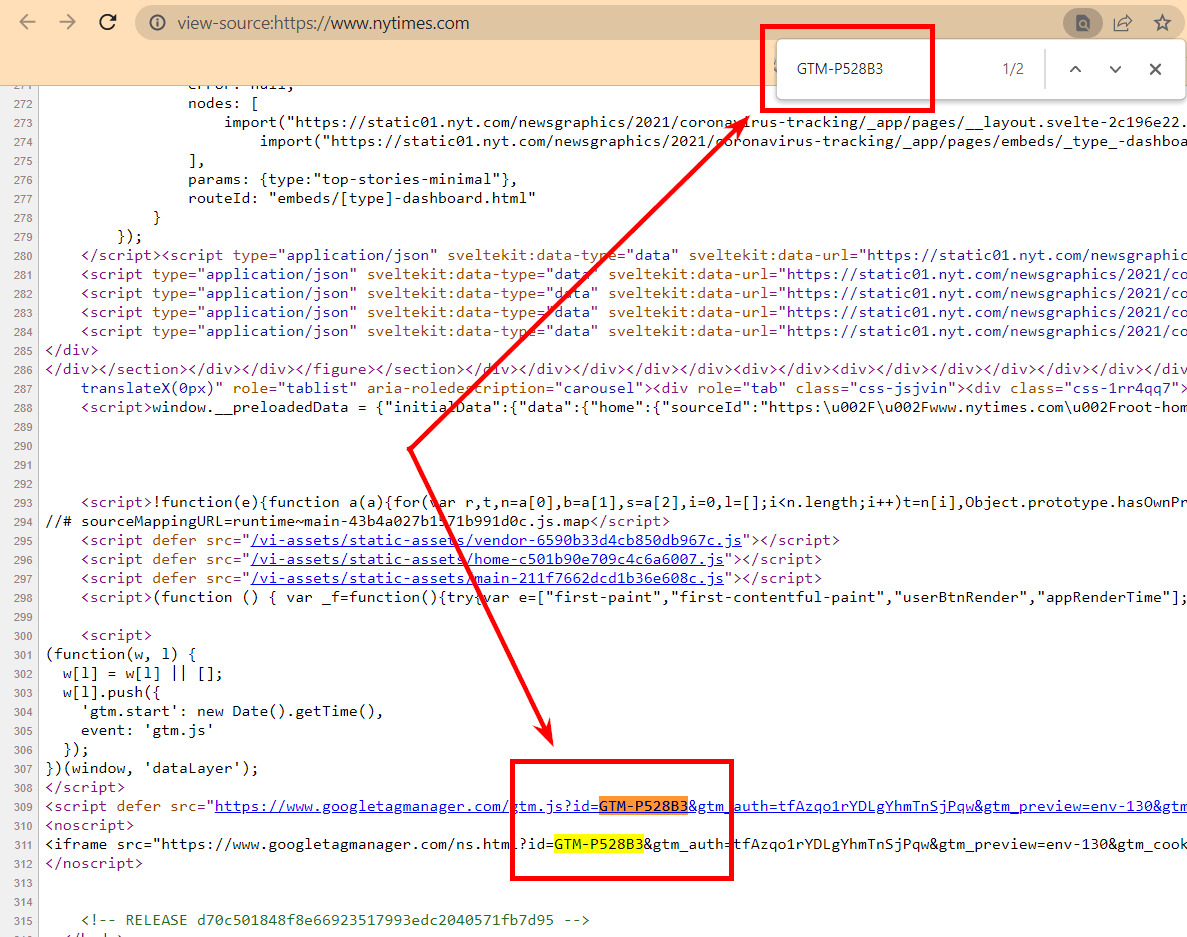
If the container ID from your personal account exactly matches the one in the code, you can proceed to configuration.
The main drawback is that this method only allows you to check one page of a site. GTM should be installed on all pages, and it doesn’t allow for mass testing.
It’s important to understand that the presence of Google Tag Manager on one page does not mean that it is configured correctly and is working on the site as a whole.
Checking with Google Tag Assistant
Google Tag Assistant is a browser extension that lets you check GTM installation with one click. This Google plugin highlights tags in different colors depending on their status.
1. Install Google Tag Assistant from the Chrome Store.
2. Go to the page for which you need to check the correct operation of GTM, launch the Google Tag Assistant extension, and refresh your browser.
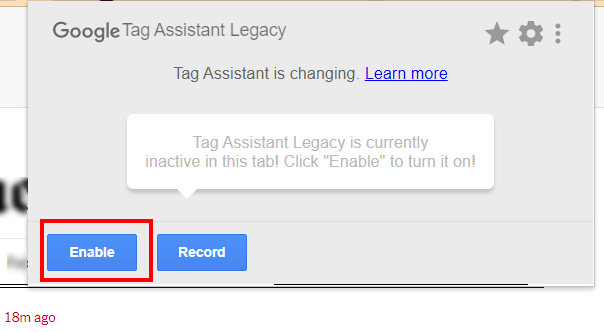
3. After updating, open Google Tag Assistant again, and if GTM is present, the extension will detect it.
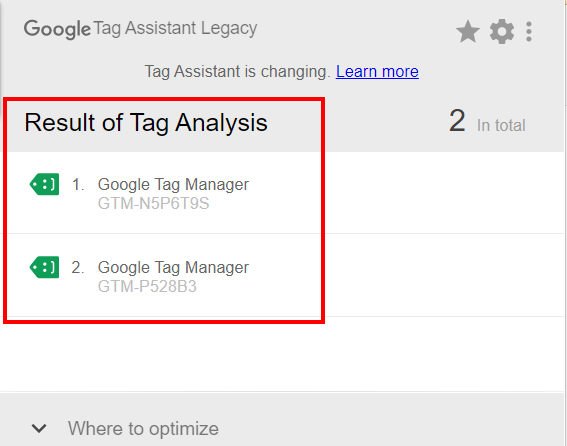
The downside of this method is the limited scope of testing. If the site is large, checking all pages using Google Tag Assistant will take a very long time.
Chrome Developer Tools
You can also use the developer console to check that Google Tag Manager is working correctly.
- Check in the “Network” tab:
- open the console using the combination “ctrl+shift+i”;
- click “Network”;
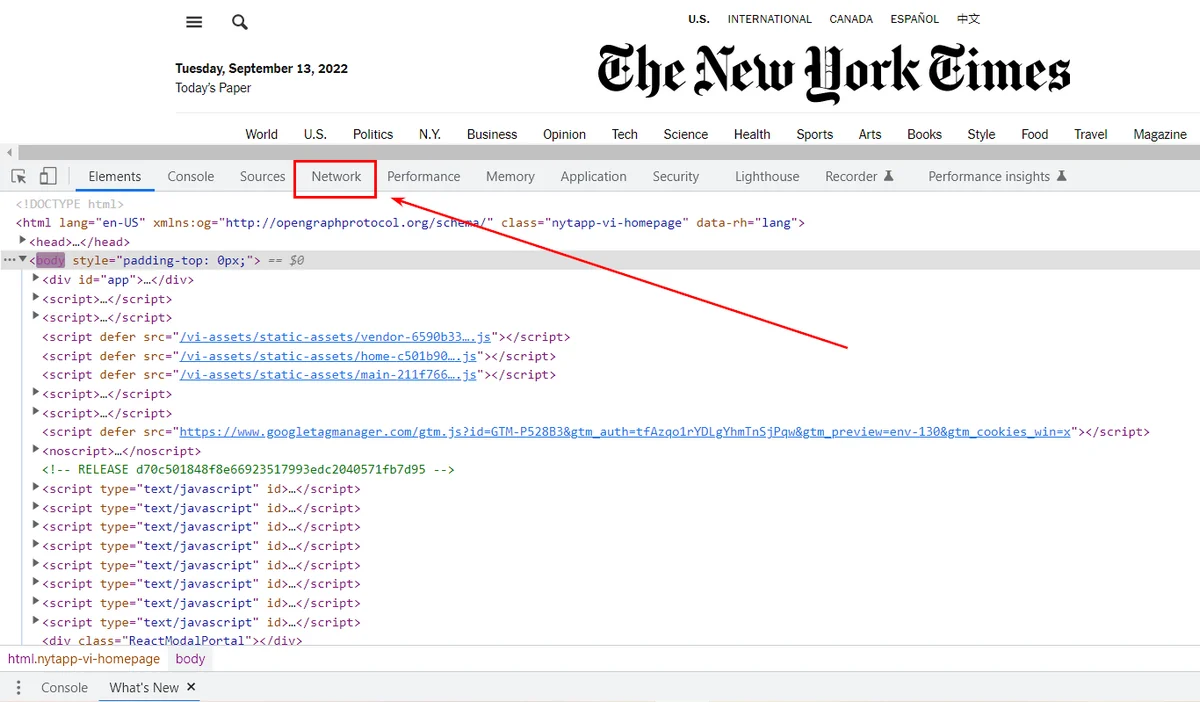
- In the Filter field, enter “GTM”.
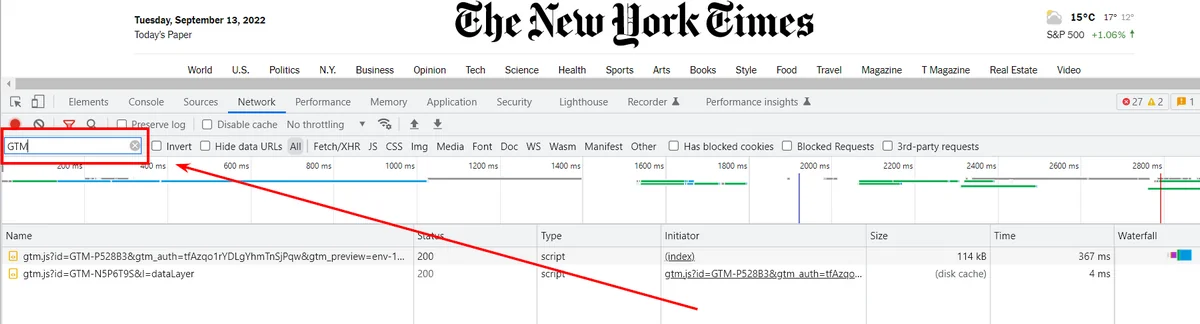
- Server response code 200 means that the tag is present and working correctly.
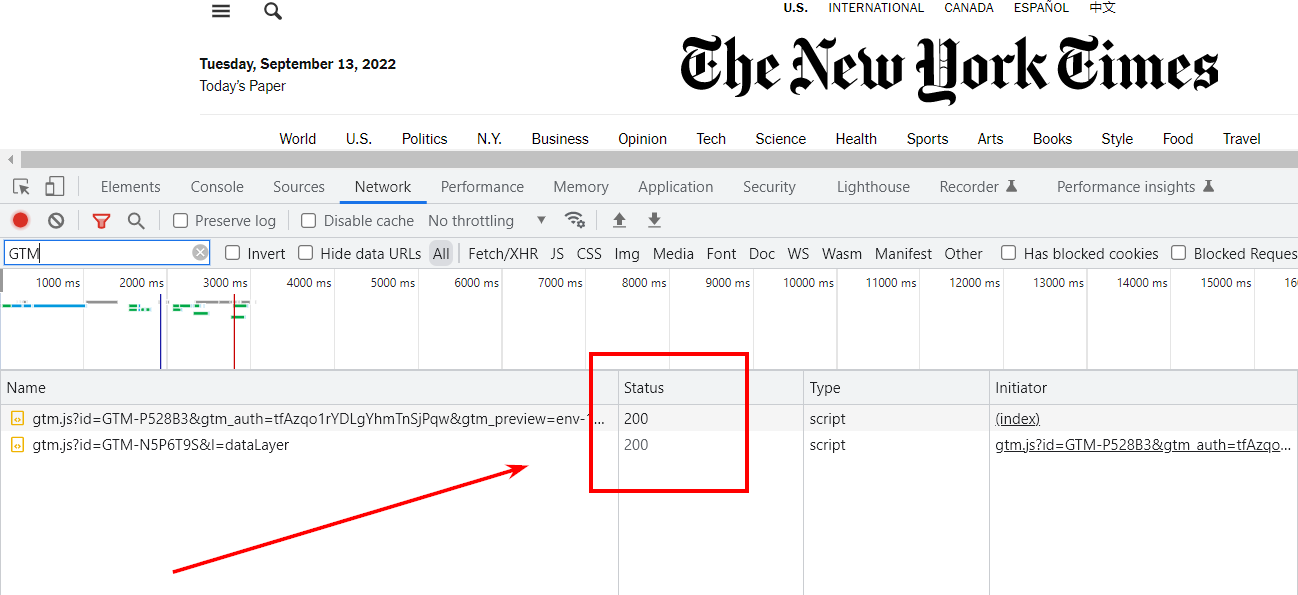
Check in the “Elements” tab:
- open the console using the combination “ctrl+shift+i”;
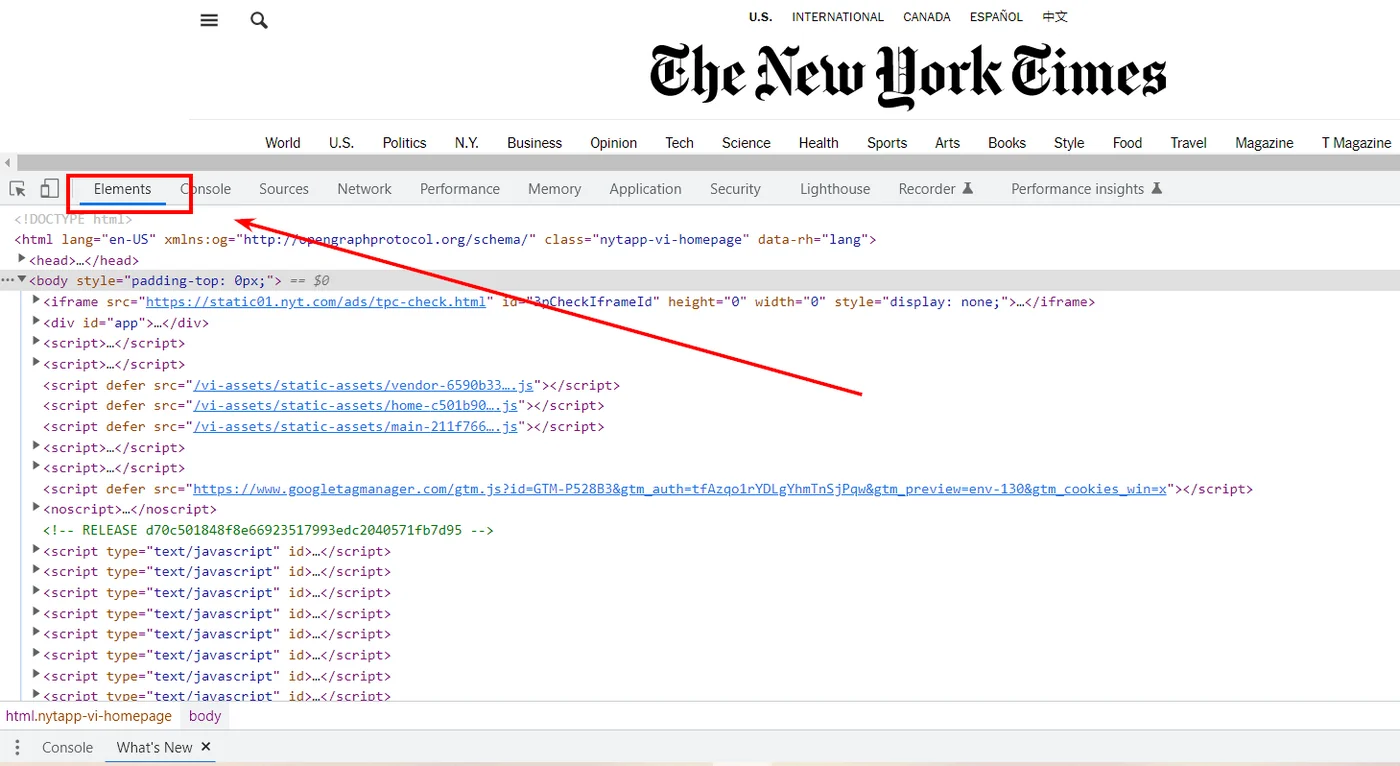
- “ctrl+f” – open the search bar;
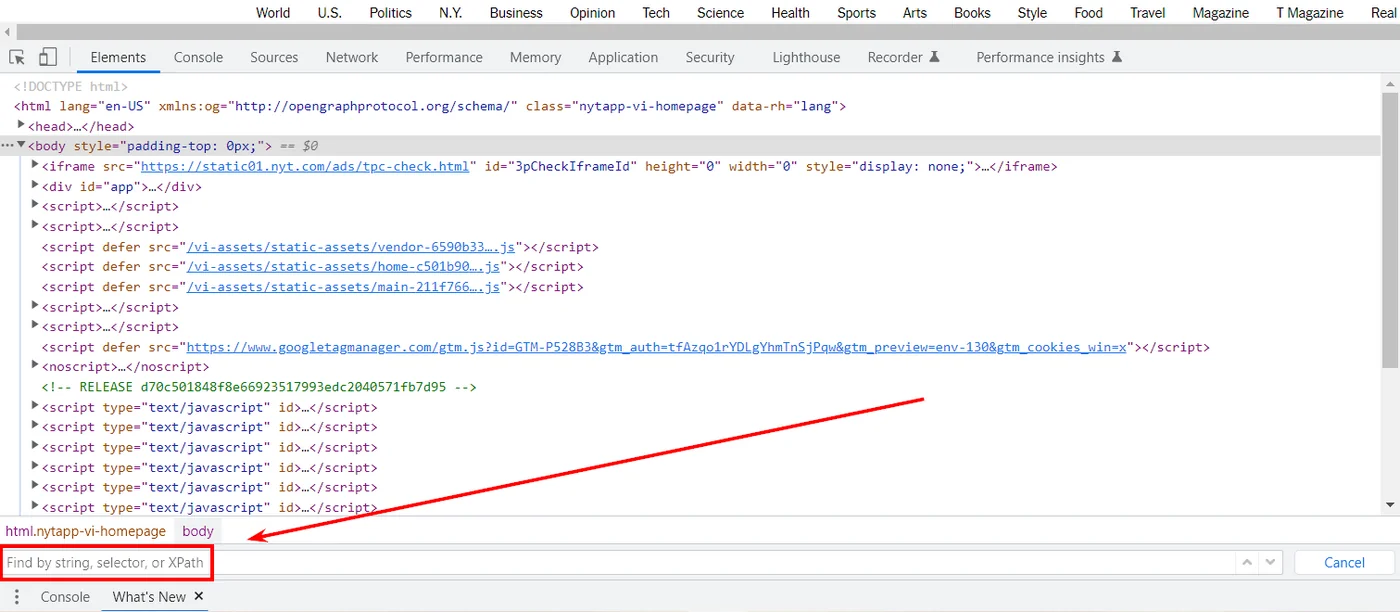
- enter “gtm”.
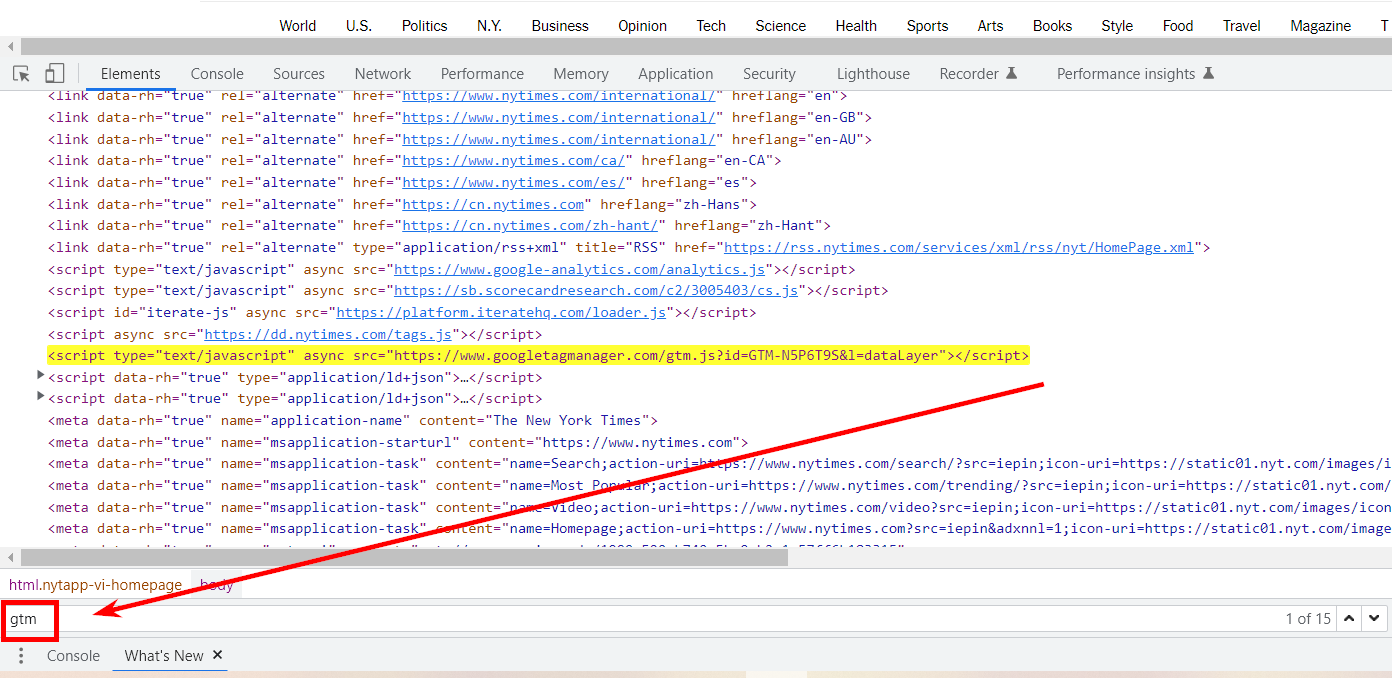
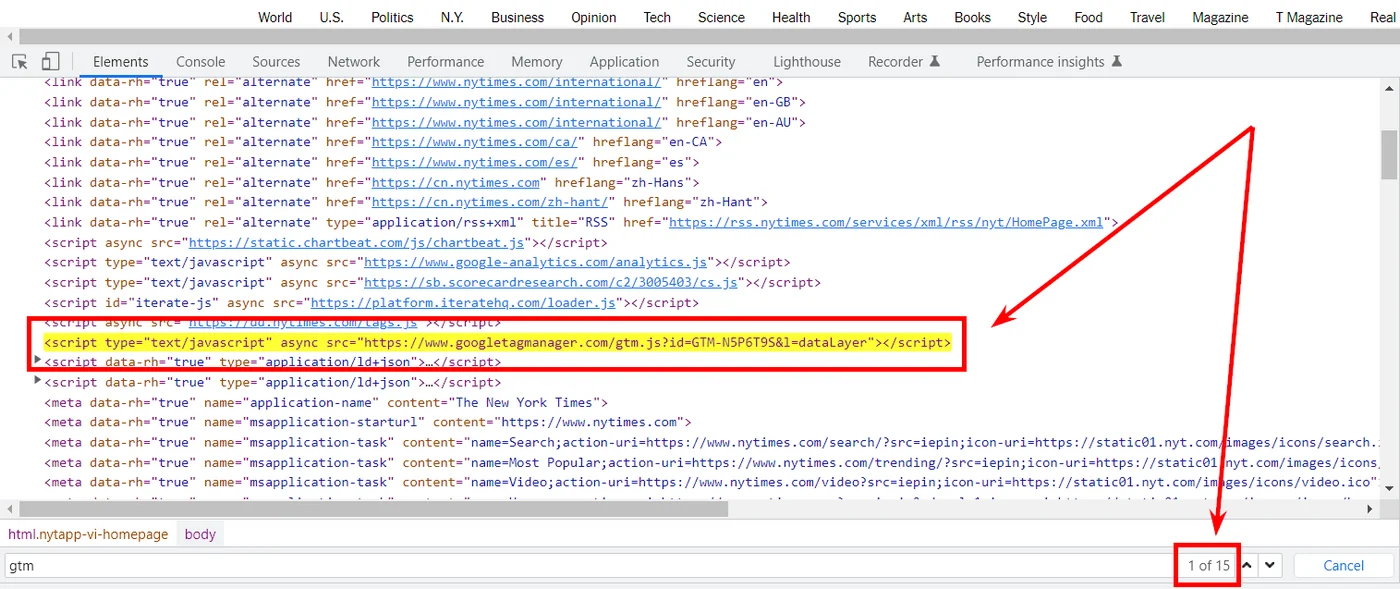
If the Google Tag Manager container is implemented correctly, you will be able to see it.
Disadvantages of checking using developer tools:
- There is no way to check multiple pages at the same time.
- The presence of GTM in the code does not indicate the correctness of its settings and operations.
If the check fails, please refer to the Google Developer documentation for GTM or reinstall the container.
Checking the correct operation of GTM on the site
If Google Tag Manager is already connected and configured on your site, you need to check that the tags are firing correctly. There are several ways to test your GTM container.
Google Tag Manager Preview and Debug Console
The most detailed and visual way to verify correct operation is to use the preview and debug console. This allows you to determine with maximum precision which settings are triggered and under what conditions. Furthermore, the console displays all installed tags, regardless of whether they are configured correctly. This means you can trim or fine-tune any non-functional tags.
To access the preview and debug console:
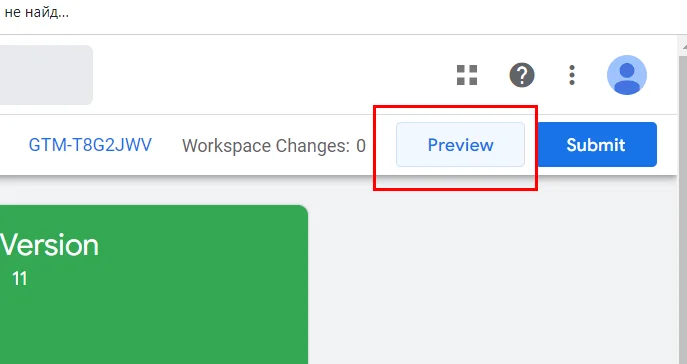
- Open Google Tag Manager and click “Preview” in the top right corner.
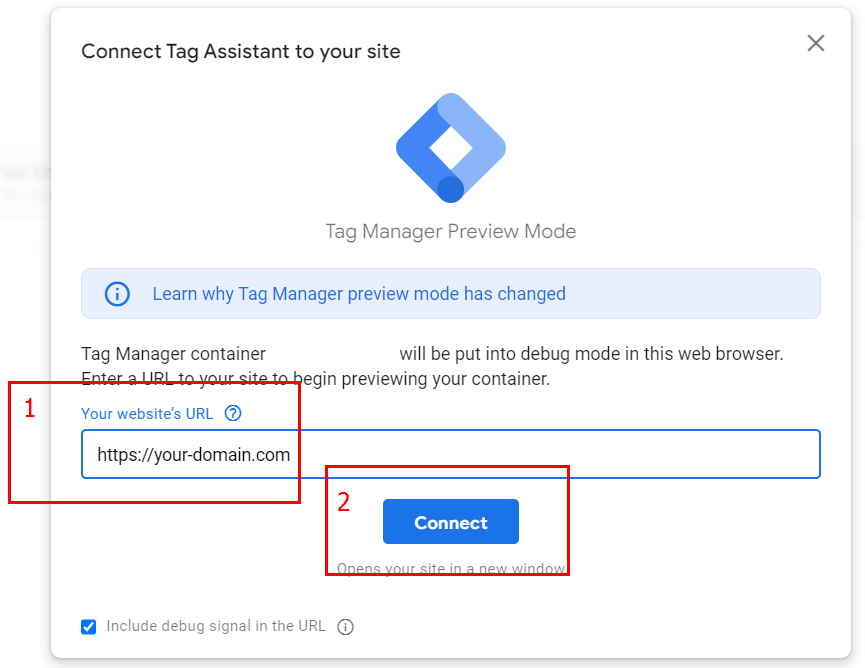
- Enter your domain in the appropriate line and click the “Connect” button.
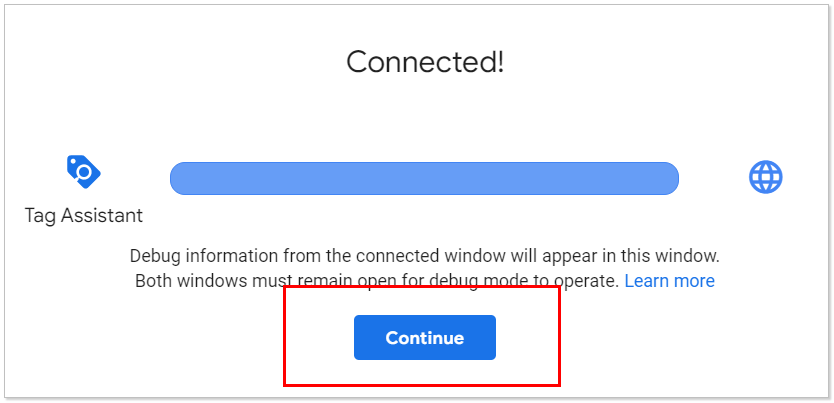
- Once successfully connected, “Connected” will appear. Click “Continue.”
If you complete the steps correctly, the GTM debug console will open with a full list of all tags for the page.
In addition, a new tab will open: http://your-domain-name.com/?gtm_debug=12345678910, duplicating the page of your site.
If your site has tags that fire when the page is opened, they will be listed under the “Tags Fired” category in the debug console. A counter will be displayed under each tag (in this example, each tag fired once).
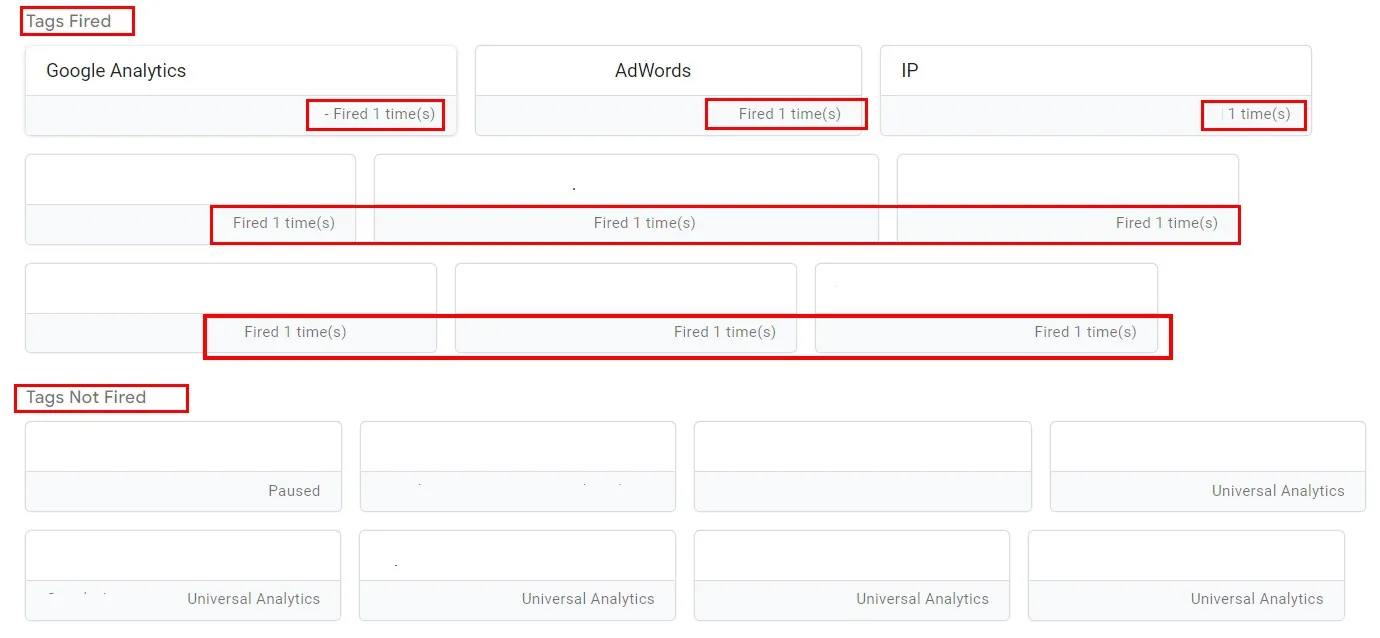
Unfired tags will be listed in the “Tags Not Fired” list.
All you have to do is check the correctness of the configured tags on the page that opens: http://your-domain-name.com/?gtm_debug=12345678910. Create the conditions for which you configured the tag, and in the GTM debug console, this tag should move from the “Tags Not Fired” list to “Tags Fired” with a counter value of +1.
If a tag is already in the “Tags Fired” category and you re-create the same conditions, the “Fired” counter of a correctly configured tag should increase by +1 to the old value.
When creating conditions, the tag isn’t triggered, or the counter records an incorrect number of triggers. This means there was an error during setup and adjustments are required.
Google Tag Assistant
As a reminder, in addition to detecting the presence of GTM, the extension highlights the results in different colors. If a tag is highlighted in yellow/gray/red, it means there are configuration issues. Click the tag icon to see the details. Green means it’s configured correctly.
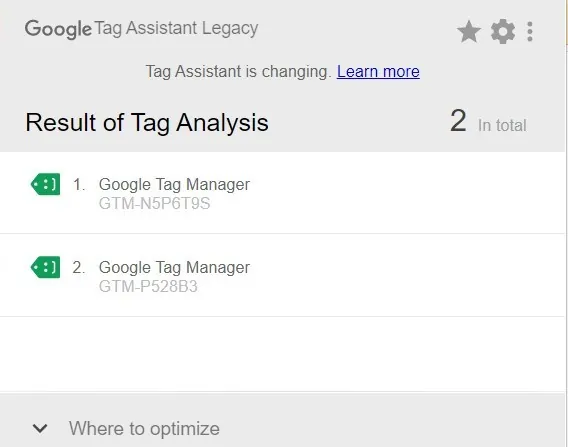
Using the Google Tag Assistant utility, you can record actions and track triggers triggered by them. To do this:
1. Go to the website you want to check.
2. Open the Google Tag Assistant extension and click “Record”.
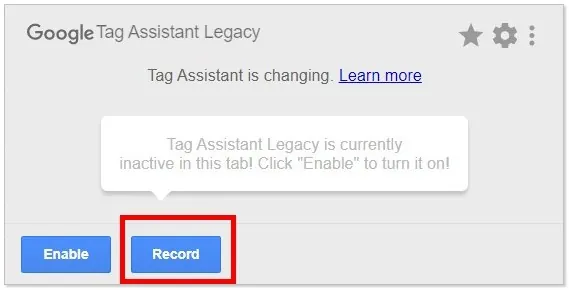
3. Perform the actions required to activate the triggers on the website.
4. Stop recording by opening the extension and clicking “Stop Recording”.
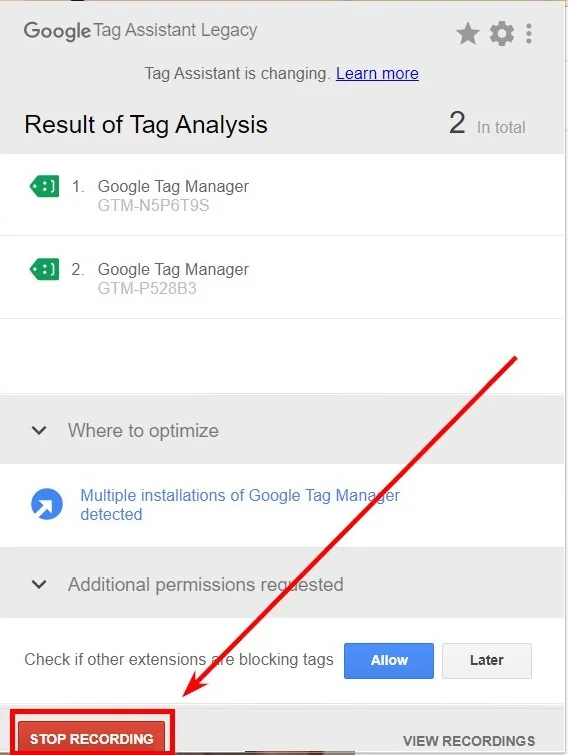
5. In the report that appears, you will see the number of pages checked and the number of tags that worked.
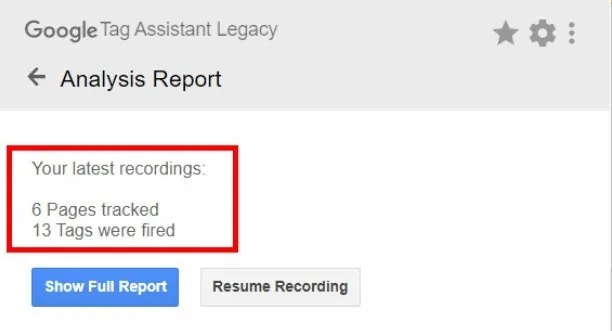
6. By clicking on the “Show Full Report” button, you will see a detailed summary page of the recording.
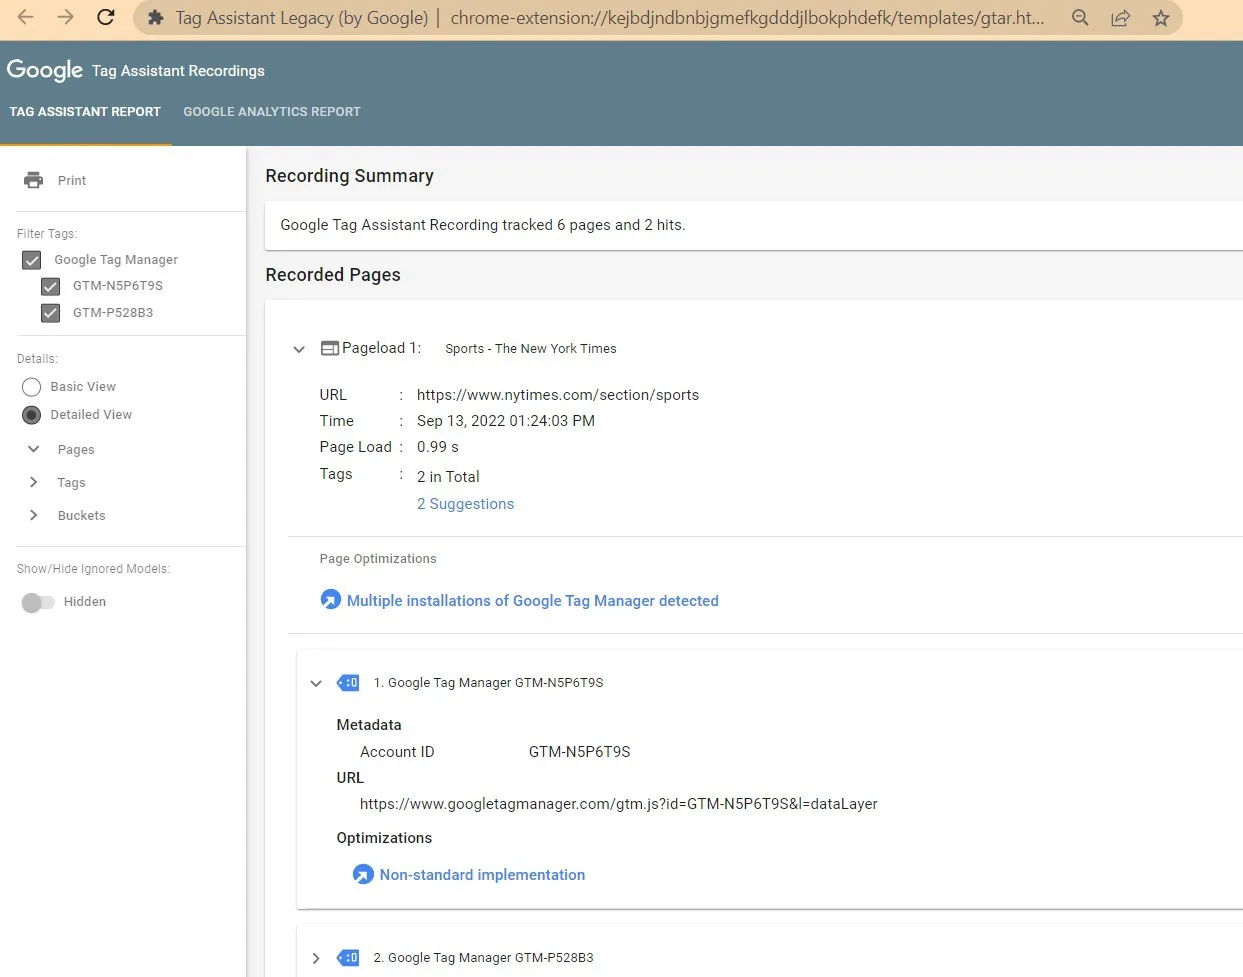
In this detailed report, tags are highlighted in blue, indicating minor but non-critical issues.
Google Analytics
If you use Google Tag Manager exclusively to set up goals and triggers, you can track the correct operation of your settings in real time using Google Analytics.
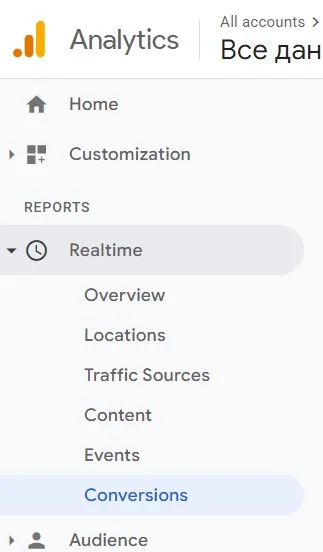
1. Go to Google Analytics.
2. Go to the “Realtime” section on “Conversions”.
3. Create conditions for the tag to fire and record the firing.
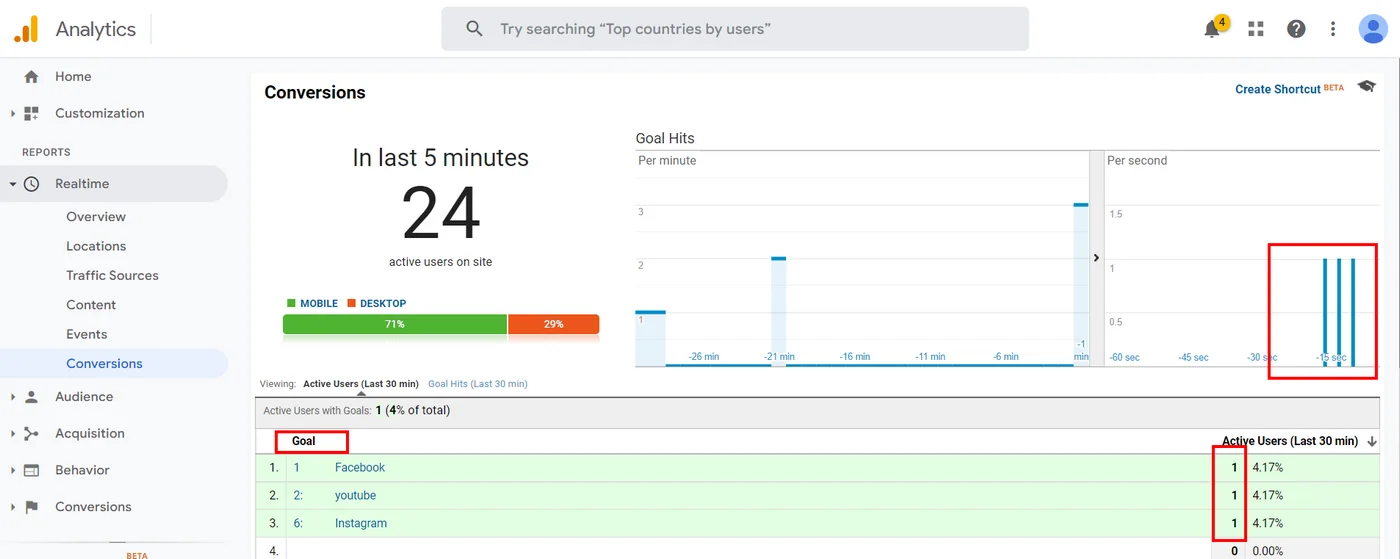
If the configured tags do not work, then an error was made and improvements are required.
Conclusions
There are several simple and reliable ways to evaluate GTM performance on a website.
You can check the presence of a GTM container using:
- search in the website code;
- Google Tag Assistant extensions;
- checks in the “Network” or “Elements” tabs in Chrome Developer Tools;
- parsing in Netpeak Spider.
The following will help you check that GTM is working correctly:
- Google Tag Manager Preview and Debug Console;
- Google Tag Assistant extension;
- Google Analytics.
This is the first step to setting up GTM correctly. This will allow you to better understand your target audience and more accurately track conversions and events on your website. The sooner you start collecting information, the sooner you can make adjustments to improve performance.
Source: Netpeak.net